5 minutes
Pension and Financial Markets Performance Update: Q3 2024
Your update on the global stock market and a look into how Penfold funds have performed this quarter.

Summer is usually a sleepy period for equities – the world goes on holiday and trading activity often reduces – but this year the world’s biggest stock markets were very much awake.
Generally, share prices across the world increased in July, August and September off the back of two seismic events: China unveiling its biggest economic stimulus package since COVID-19 and a much larger cut to US interest rates than expected.
But it wasn't all roses. There was also a huge drop across global markets in early August, sparked by a sudden increase in trading due to US economic fears. But the volatility was short-lived and stocks across the world quickly recovered.
What's an economic stimulus package?
A set of government measures designed to help boost economic activity during a difficult period.
It can be interesting to follow movements in the global stock market. But it’s also important to stay focused on your own long-term financial goals – and not get distracted or take any drastic action based on short-term ups and downs.
That being said, let’s find out what’s happening in stock markets in the US, Europe and UK – before also looking at how Penfold funds have performed this quarter.
Big growth in the US – thanks to the first interest rate cut in four years
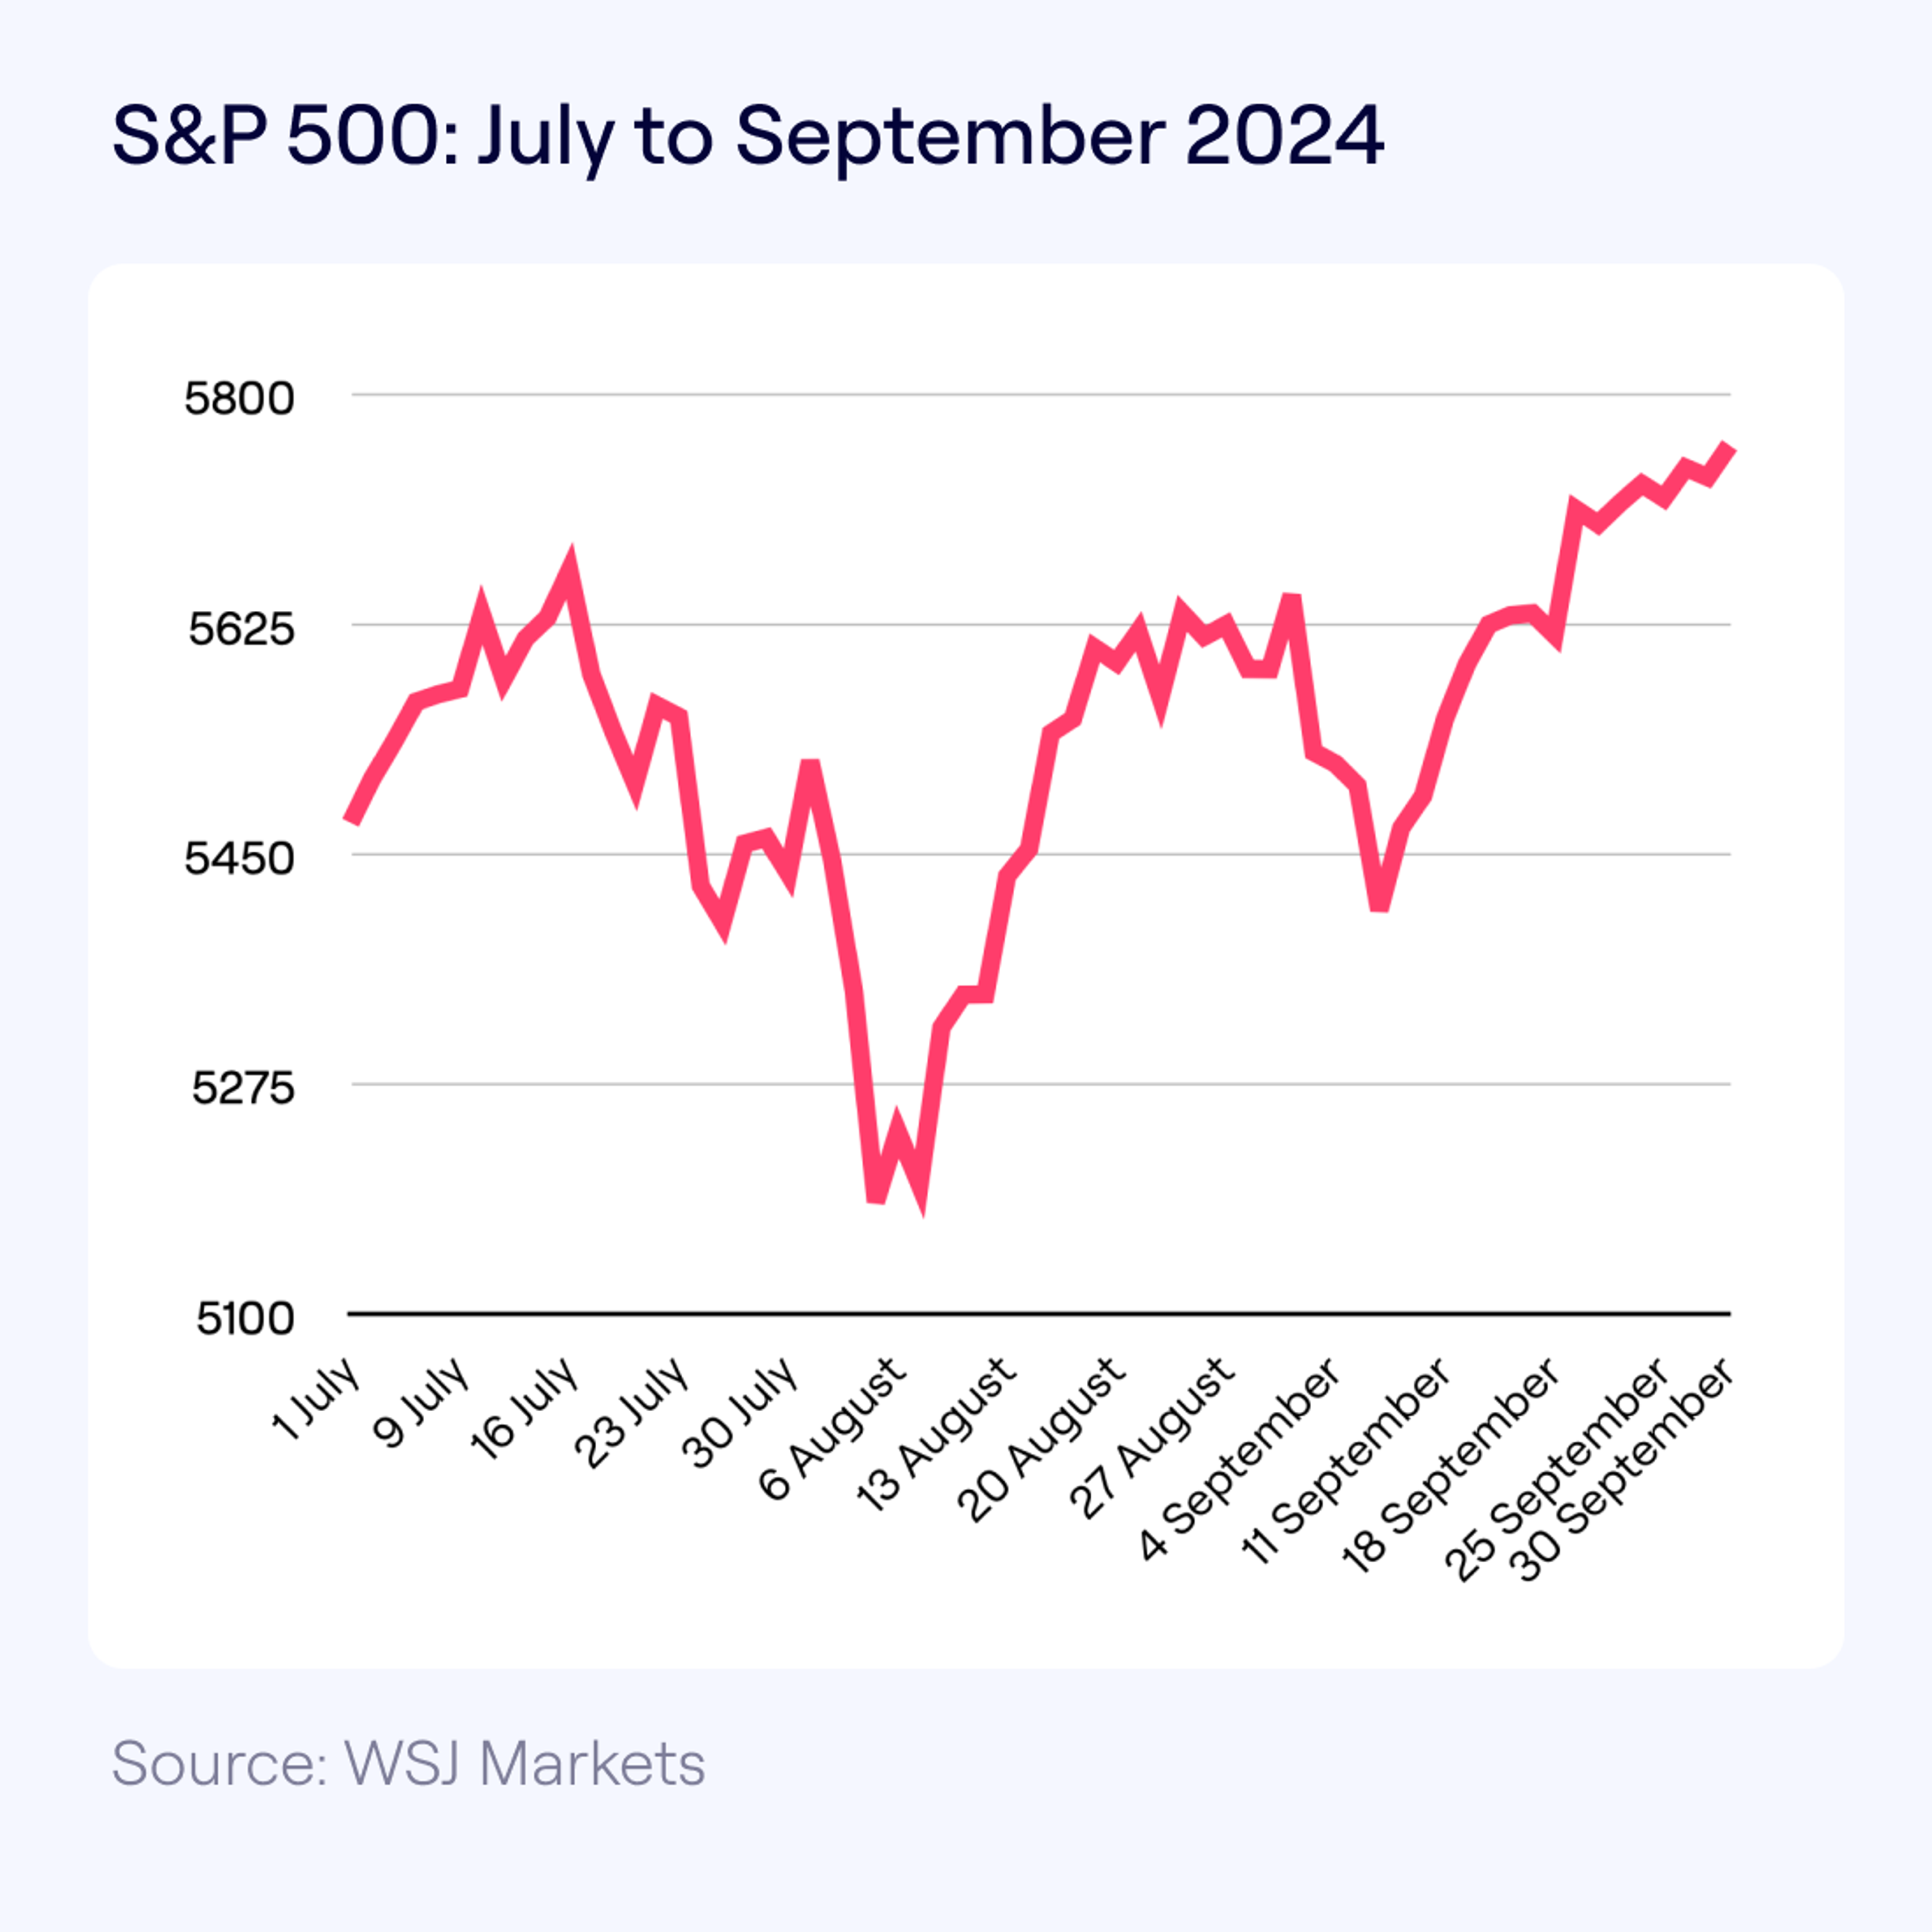
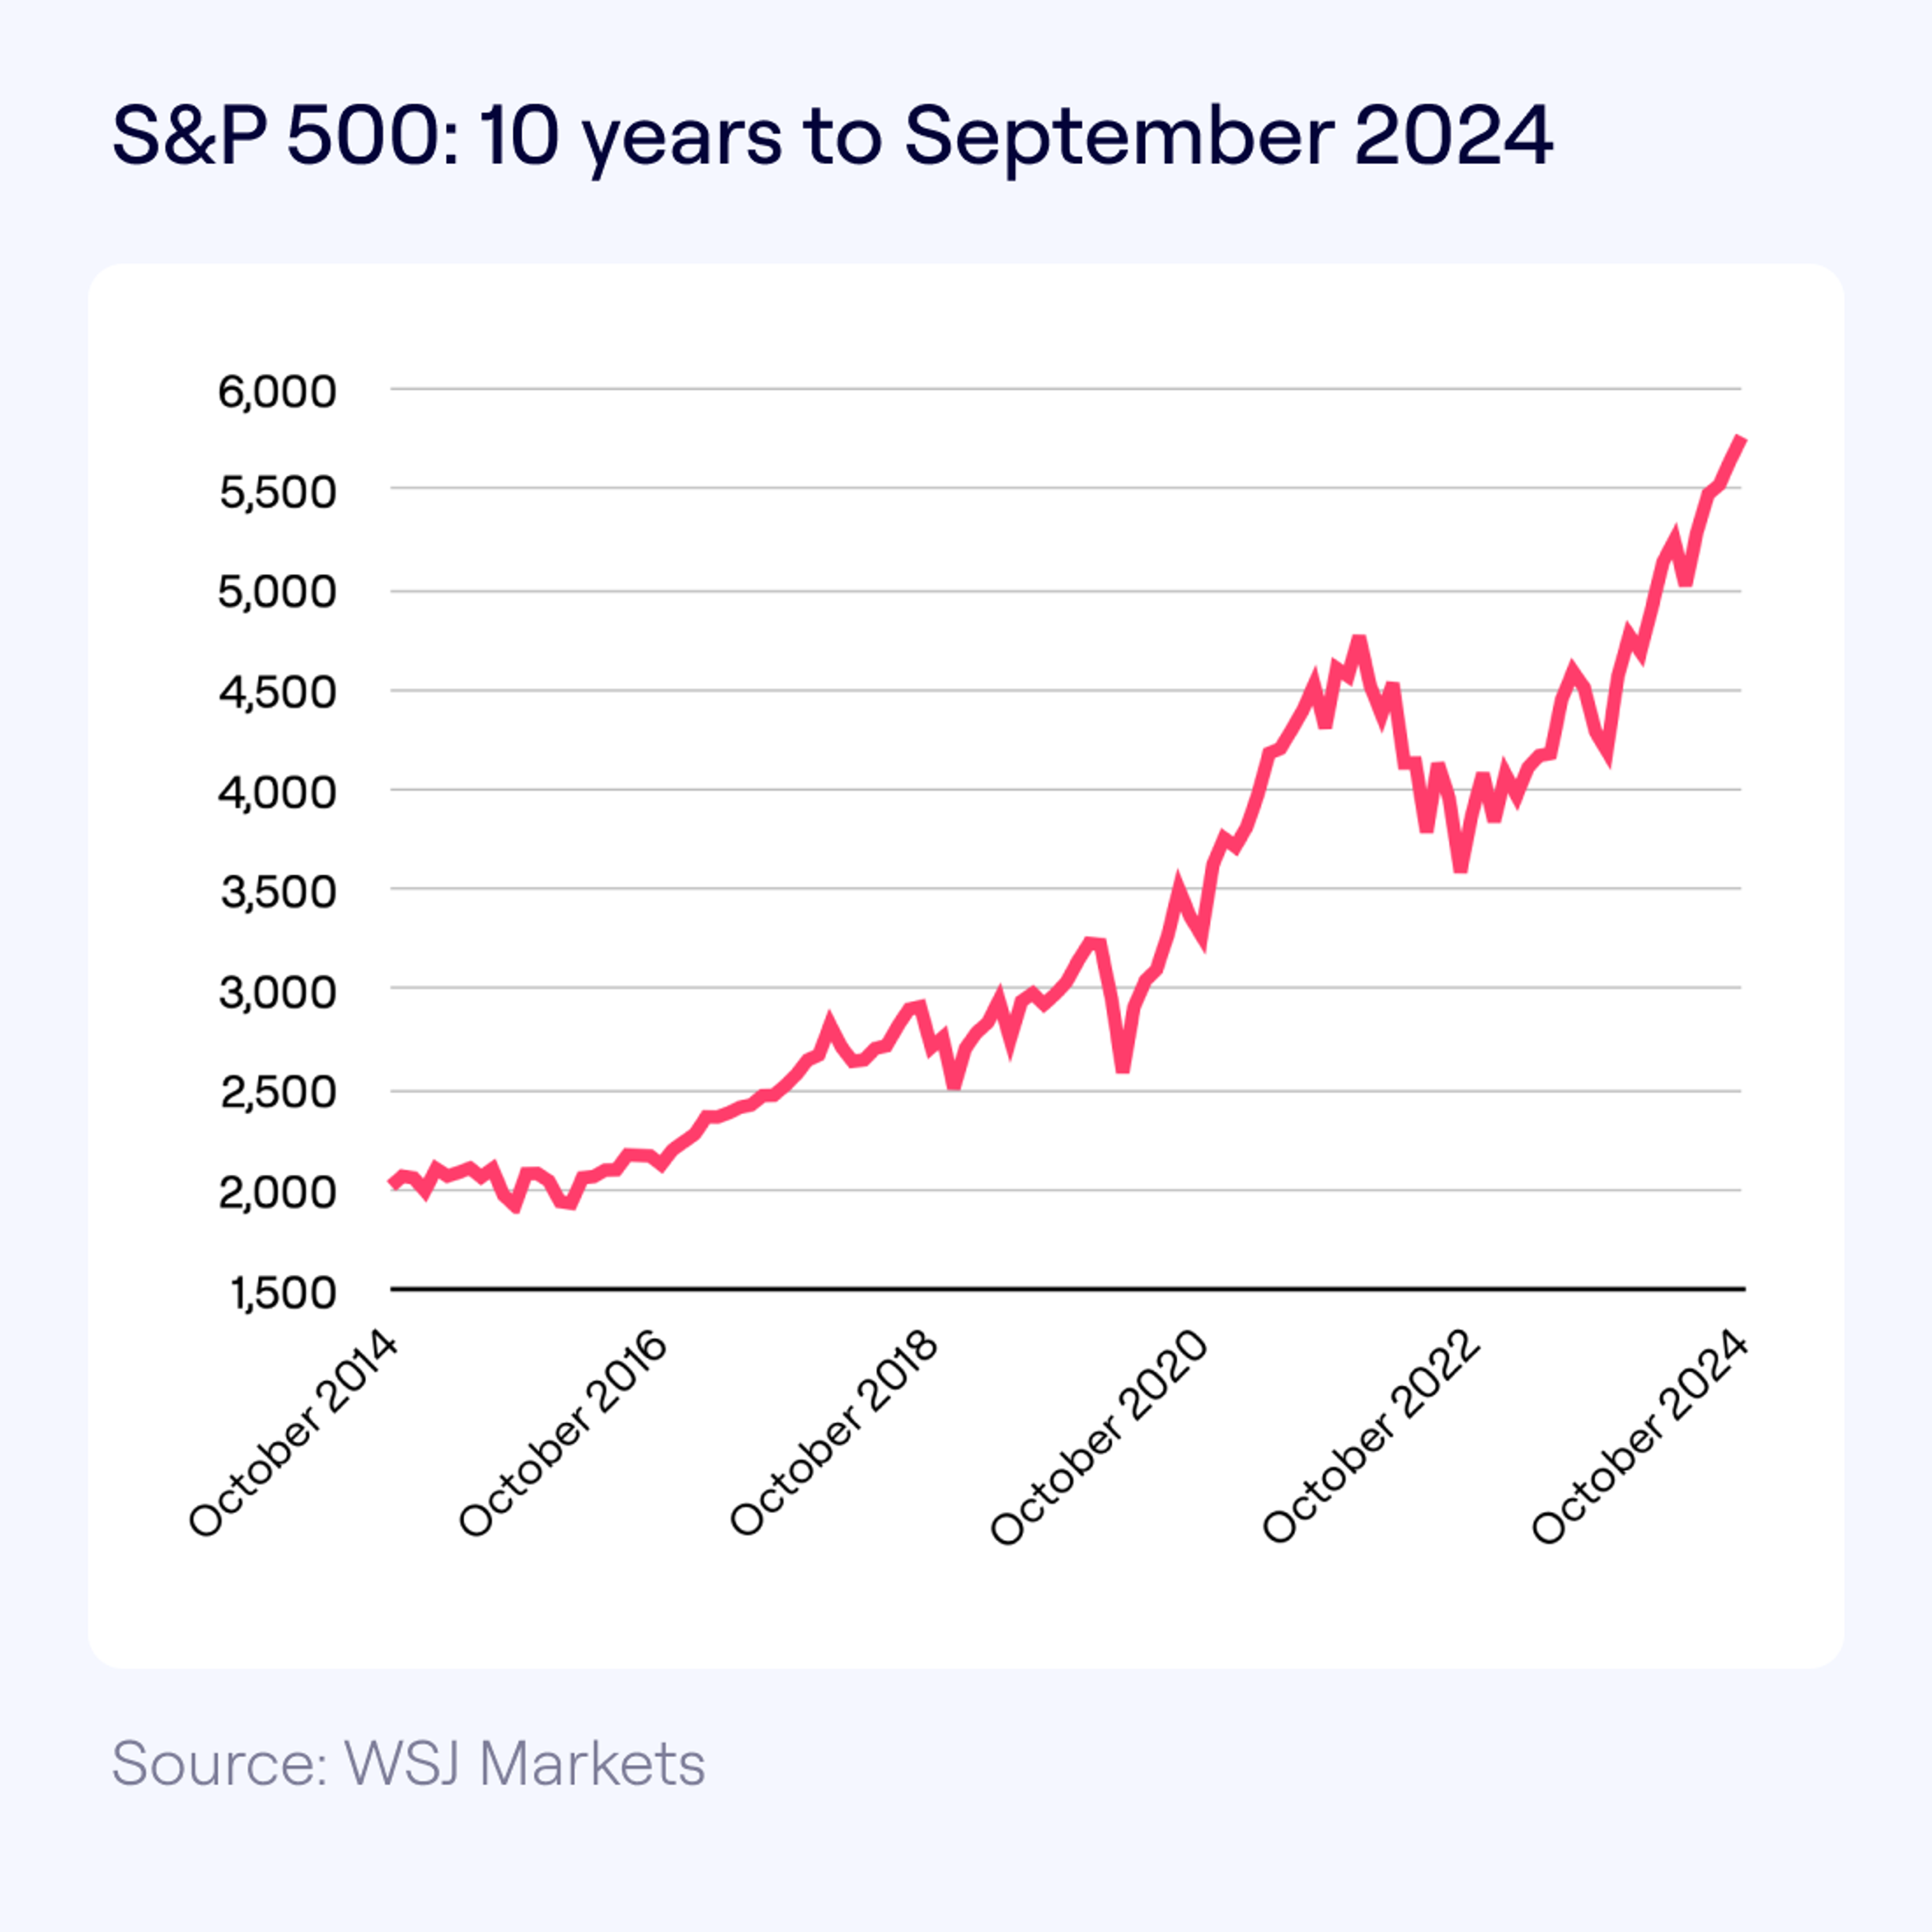
The US stock market was the top performer during Q3 2024. And for the fourth quarter in a row the S&P 500, which tracks the performance of America’s biggest 500 companies, raced upwards.
The S&P 500 rose 5.24% from the beginning of July to the end of September. This was largely thanks to the Federal Reserve Board – the US central bank – cutting US interest rates for the first time in more than four years.
The Federal Reserve cut interest by 0.5 percentage points, leaving the federal funds rate between a range of 4.75 to 5%. It also suggested it would cut rates by an additional 0.5 percentage points before the end of the year.
What do lower interest rates really mean?
Lower interest rates enable companies to borrow money at a cheaper rate, which they can then use to potentially expand their operations, increase profits and boost their share price.
Savings accounts also become less attractive and so many investors move their money into higher returning assets, such as stocks, which pushes up share prices.
Take a look at how the S&P 500 performed this quarter and over the last 10 years:
Increased exports from China mean all-time highs for European stocks
Europe had a great quarter. The pan-European Stoxx 600 index – which tracks the performance of 600 companies across Europe – rose 2.9%.
It was helped considerably by the Chinese government’s economic stimulus package. A strong China means increased exports for European companies. So when China’s central bank cut interest rates in September to revive flagging economic growth and prevent property owners from going out of business, European stocks significantly benefited too.
Some of the big winners during the quarter were the luxury firms LVMH and Hermès, which rely heavily on Chinese demand for their goods.
“Robust” economic growth in the UK
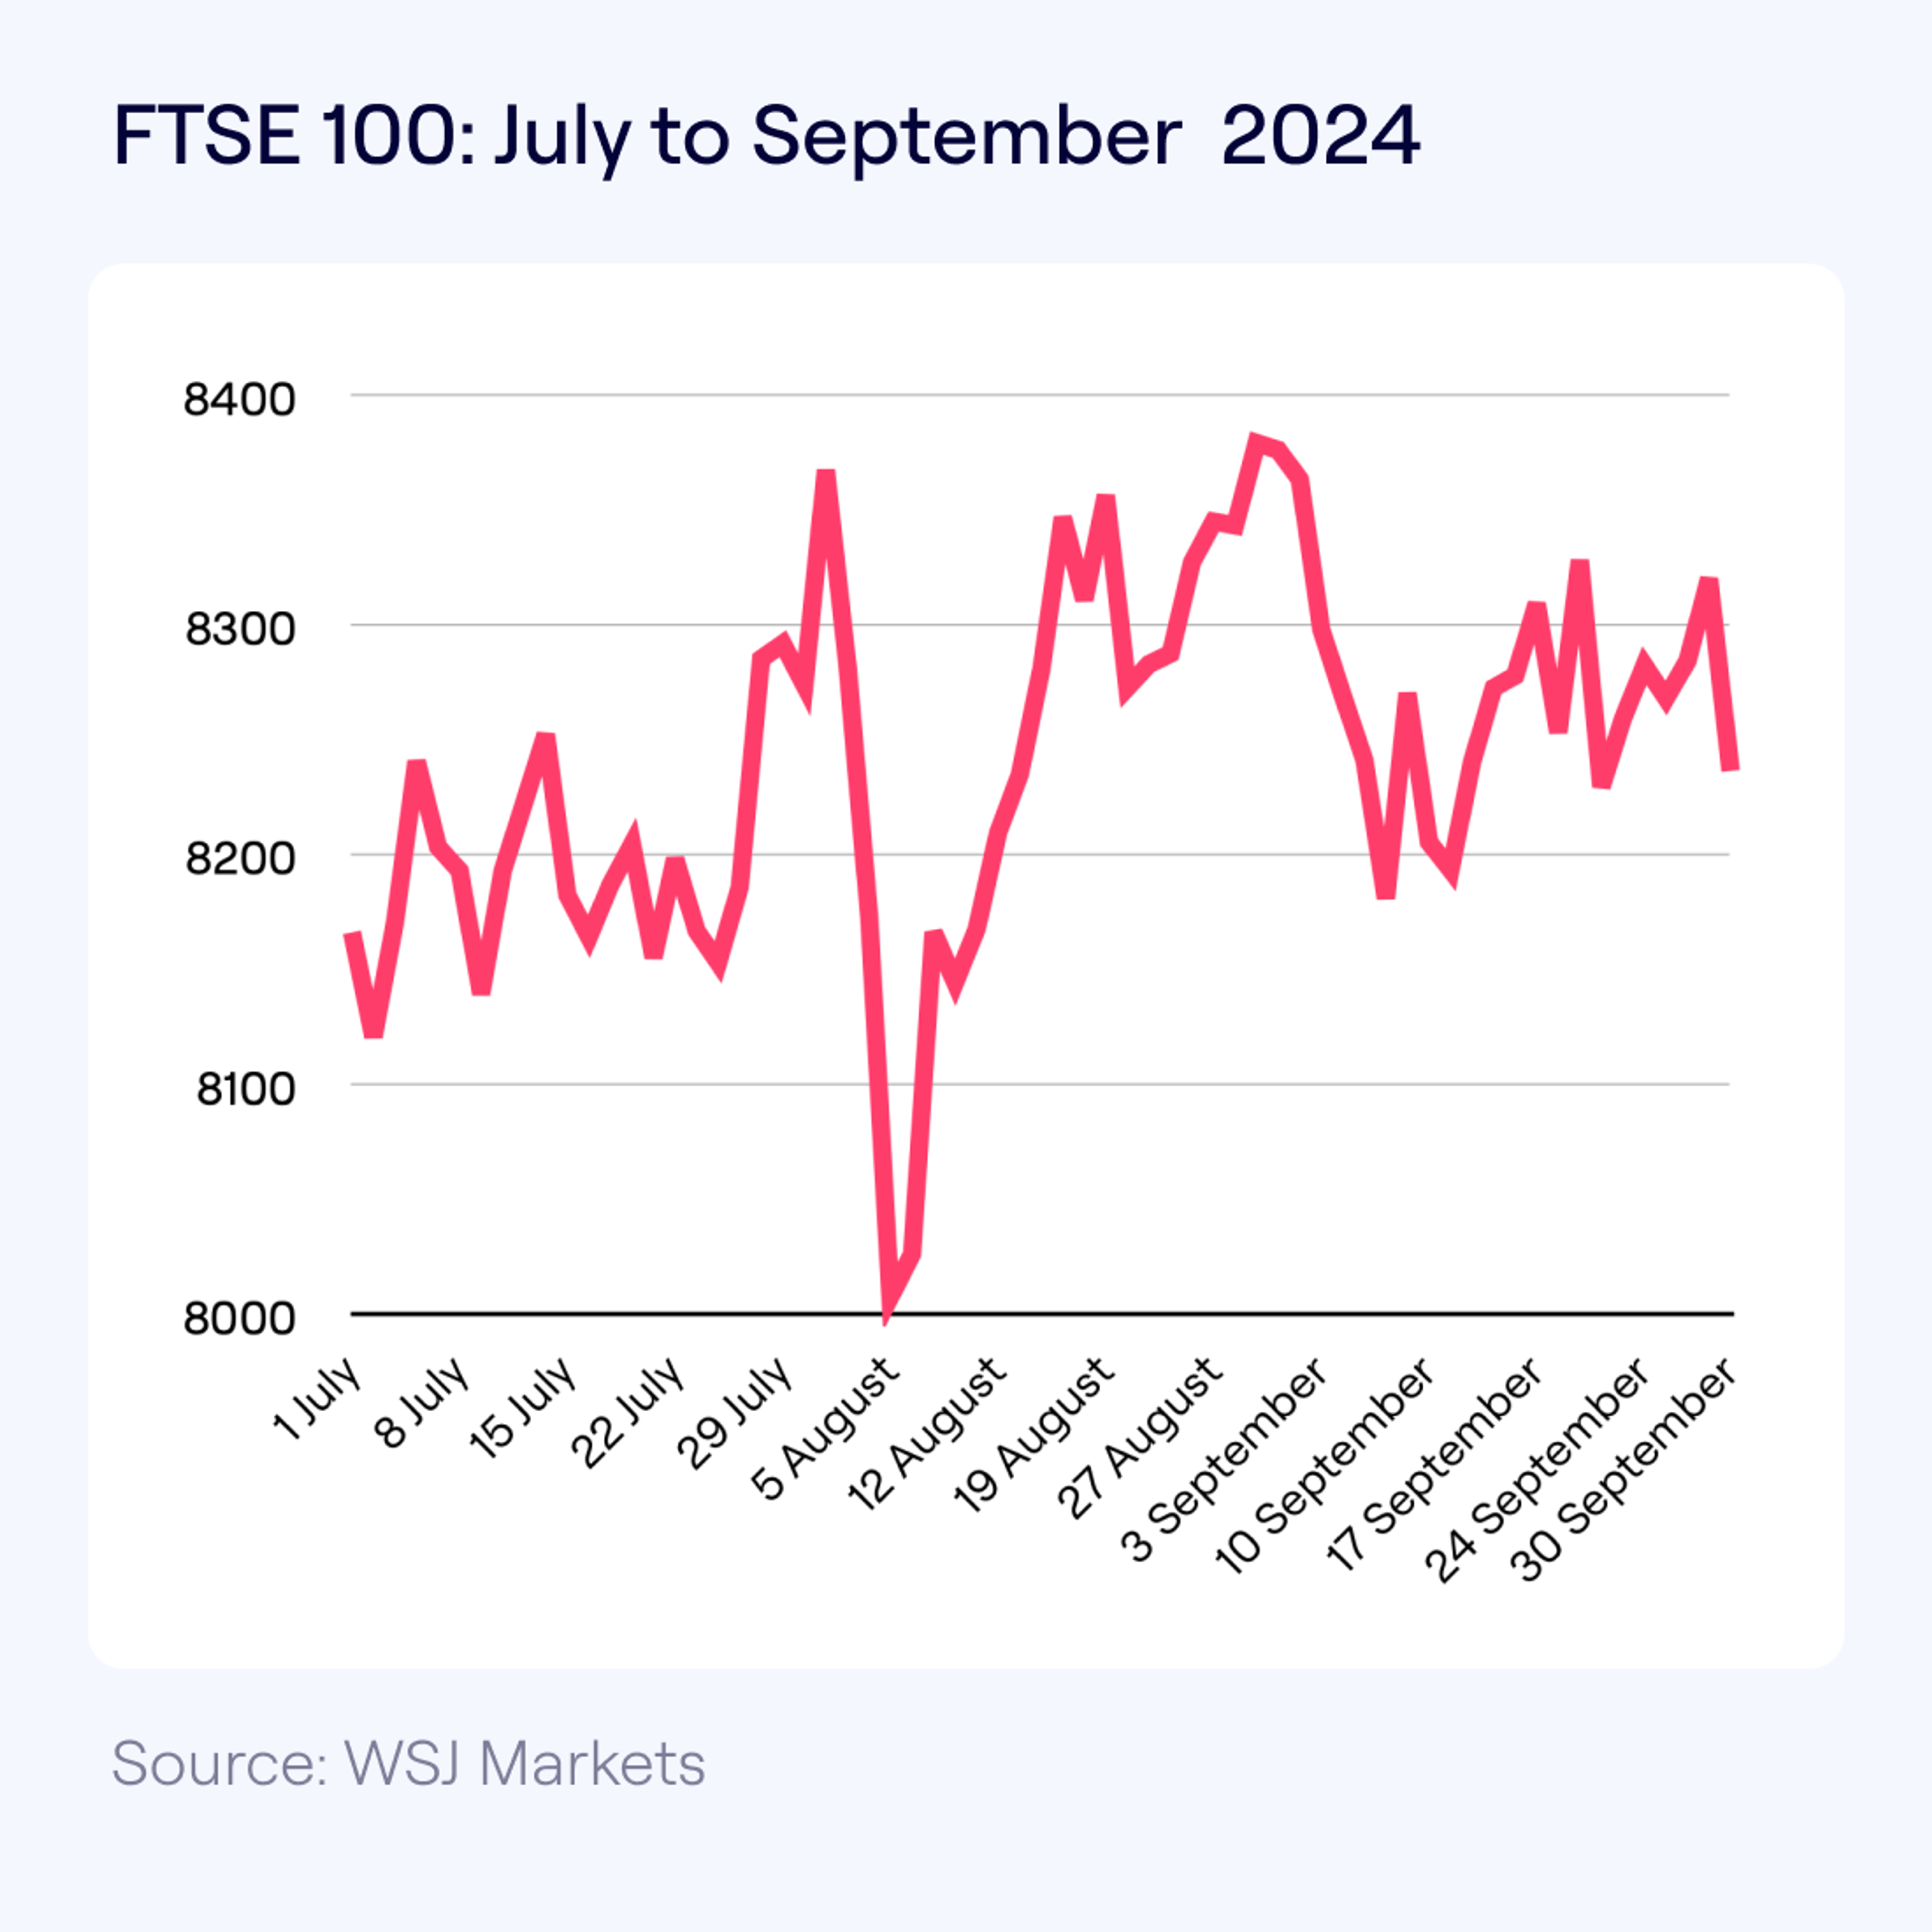
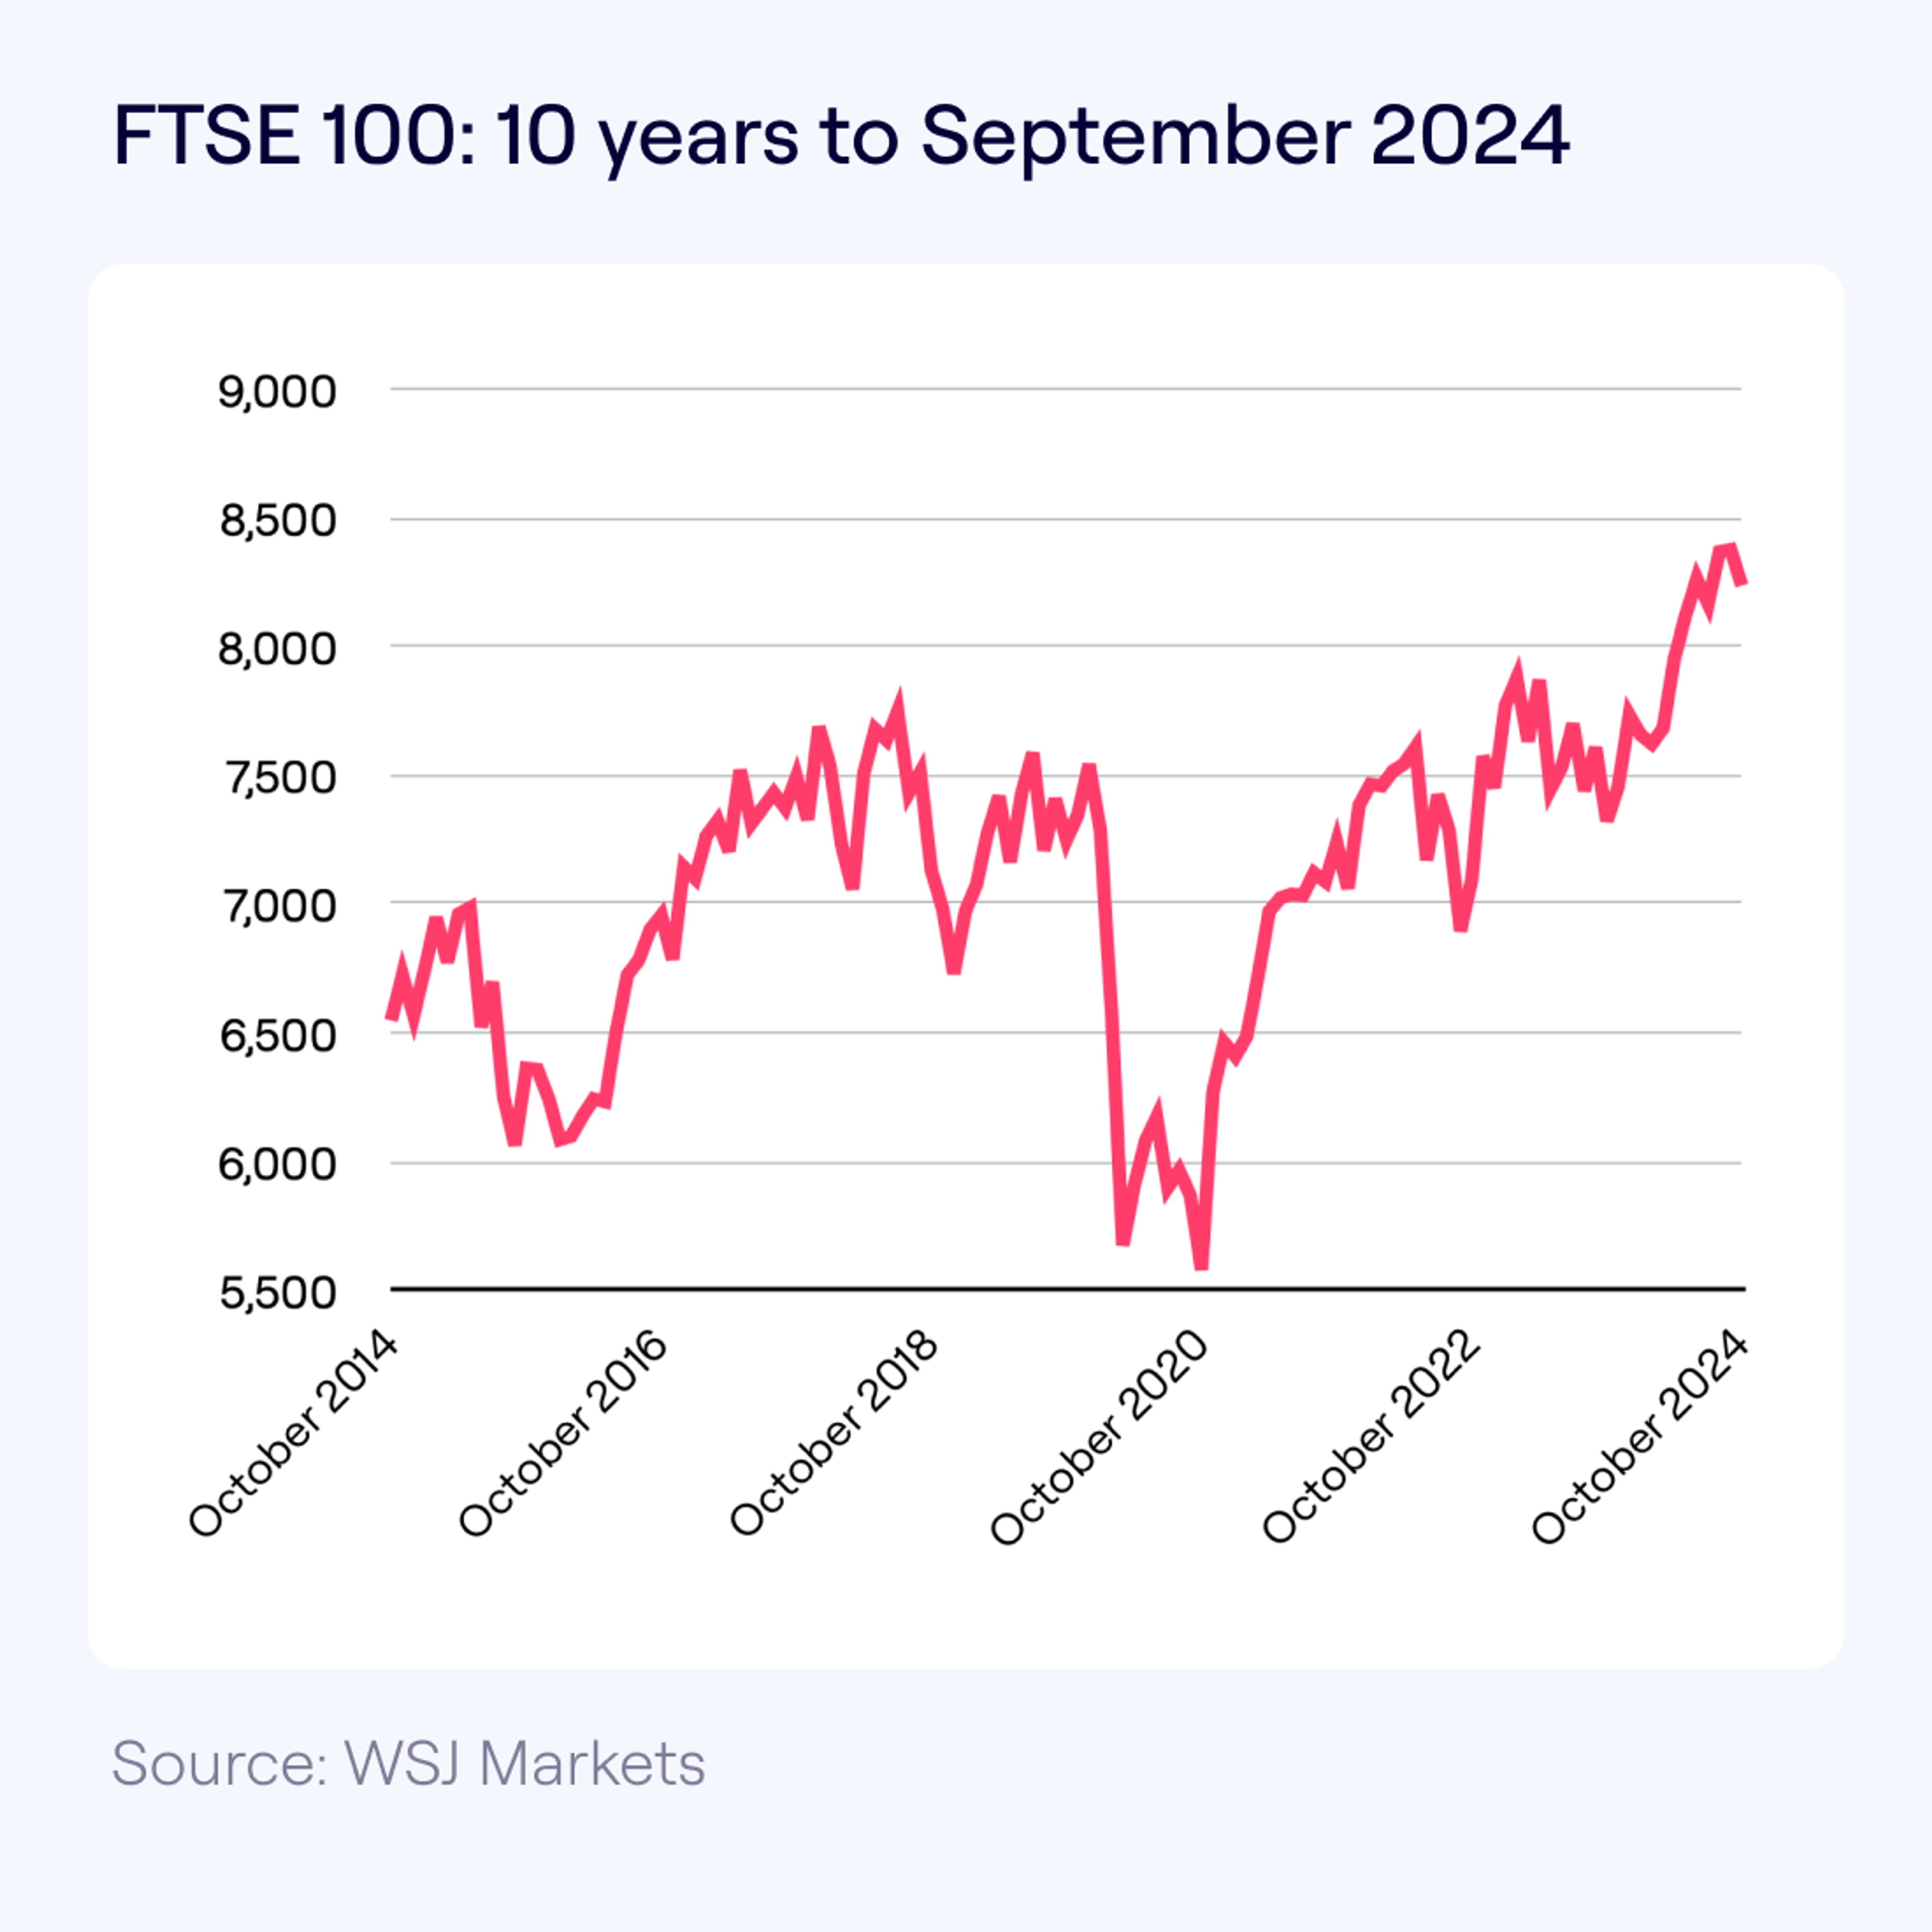
The Bank of England also reduced interest rates during Q3 2024, which saw stock prices rise for the FTSE 100, which tracks the performance of the UK's 100 biggest companies.
During the last three months, the FTSE 100 rose by 1.9%, slightly less than its 2.7% rise in Q2 2024.
But momentum seems to be building. At the end of September, the Organisation for Economic Cooperation and Development (OECD) forecast the UK economy would expand by 1.1% this year, compared to a forecast of 0.4% in the spring. It was the biggest annual growth upgrade of all the G7 countries.
And in its latest economic forecast, the OECD ranked Britain joint-second among the G7 developed countries, only behind the US. It also described Britain’s economic growth as “robust".
One of the big winners during Q3 2024 was the online property portal Rightmove. Its share price jumped more than 20% on the back of four takeover attempts by REA, an Australian property firm owned by Rupert Murdoch’s News Corp. The final bid tabled by REA valued Rightmove at a hefty £6.2bn.
See how the FTSE 100 performed over the last three months and over the last decade:
How Did Your Penfold Pension Perform in Q3 2024?
At Penfold, we have five types of plan, including Standard, Sustainable and Sharia. Our funds are built on strategically diversified portfolios designed to decrease risk exposure, limit potential losses and improve overall investment performance – and they all made gains during the second quarter.
As with any investment, your capital is at risk. The value of your investment can go down as well as up, and you may get back less than you invest. This information should not be regarded as financial advice and past performance is not a reliable indicator of future performance.
Let’s take a look at how our plans performed over this quarter.
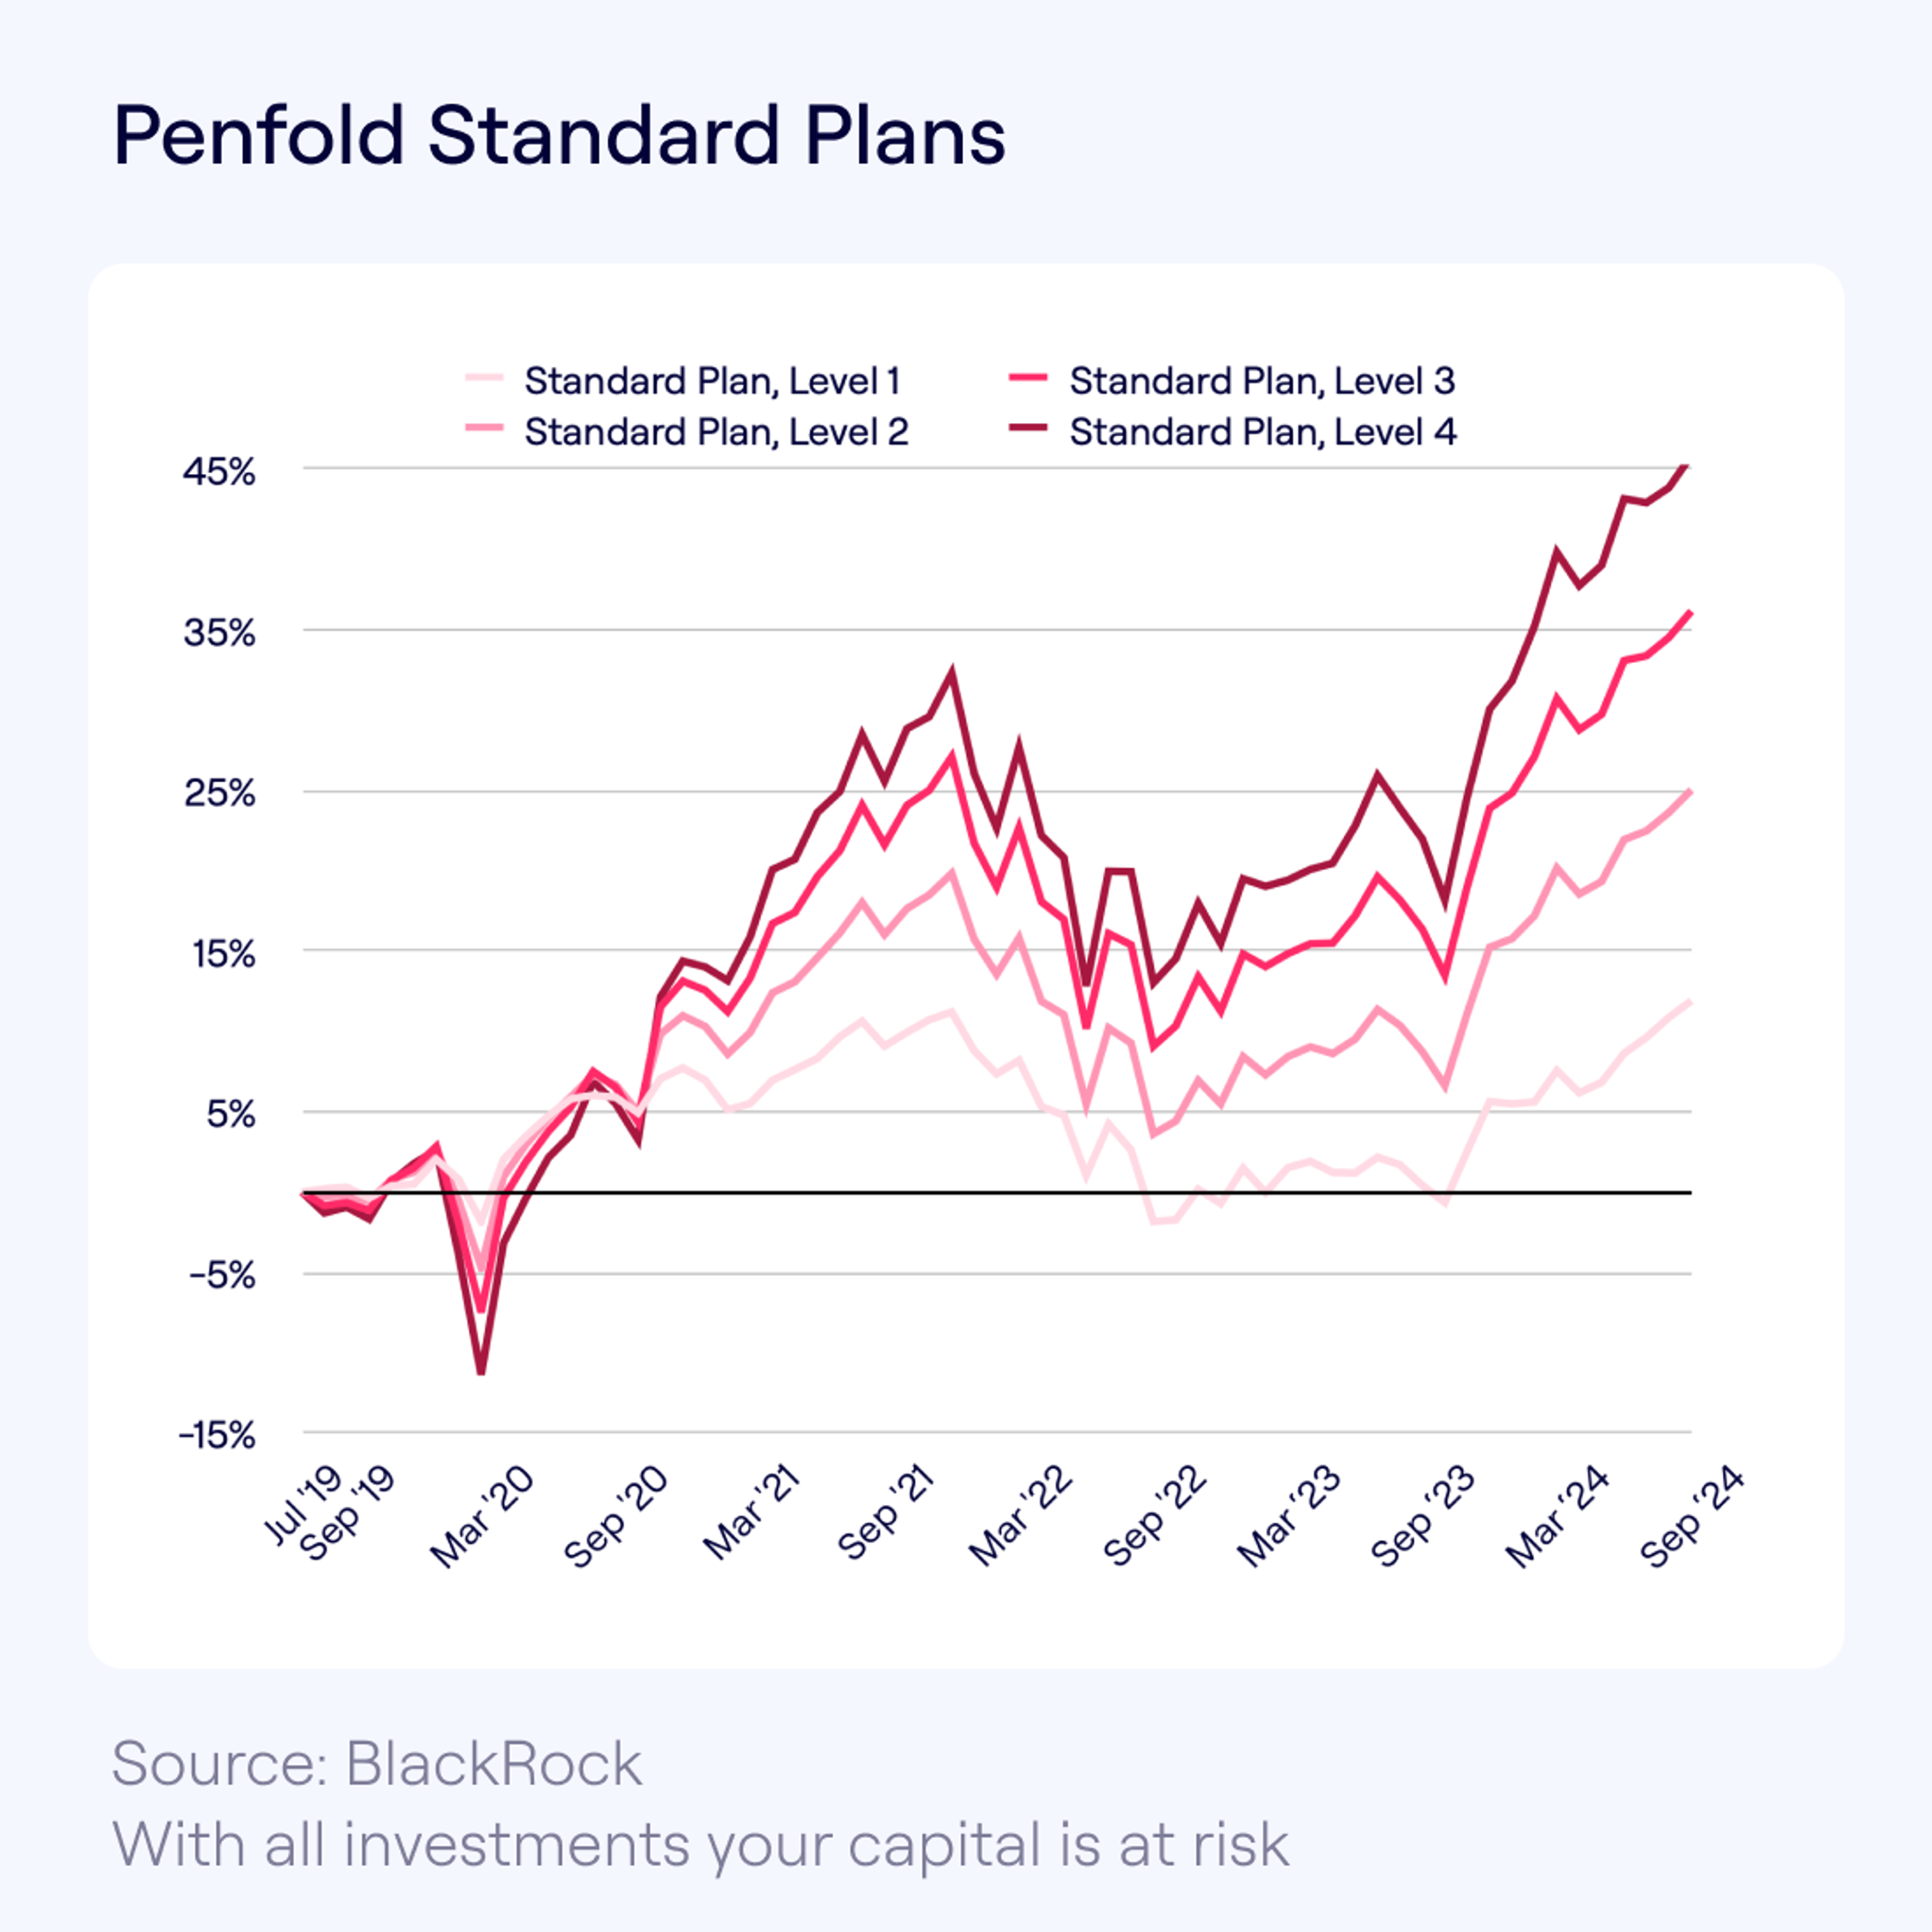
Our Standard plans all saw growth in Q3:
- Risk level 1 rose by 3.0%
- Risk level 2 grew by 2.5%
- Risk level 3 rose by 2.3%
- Risk level 4 rose by 1.9%
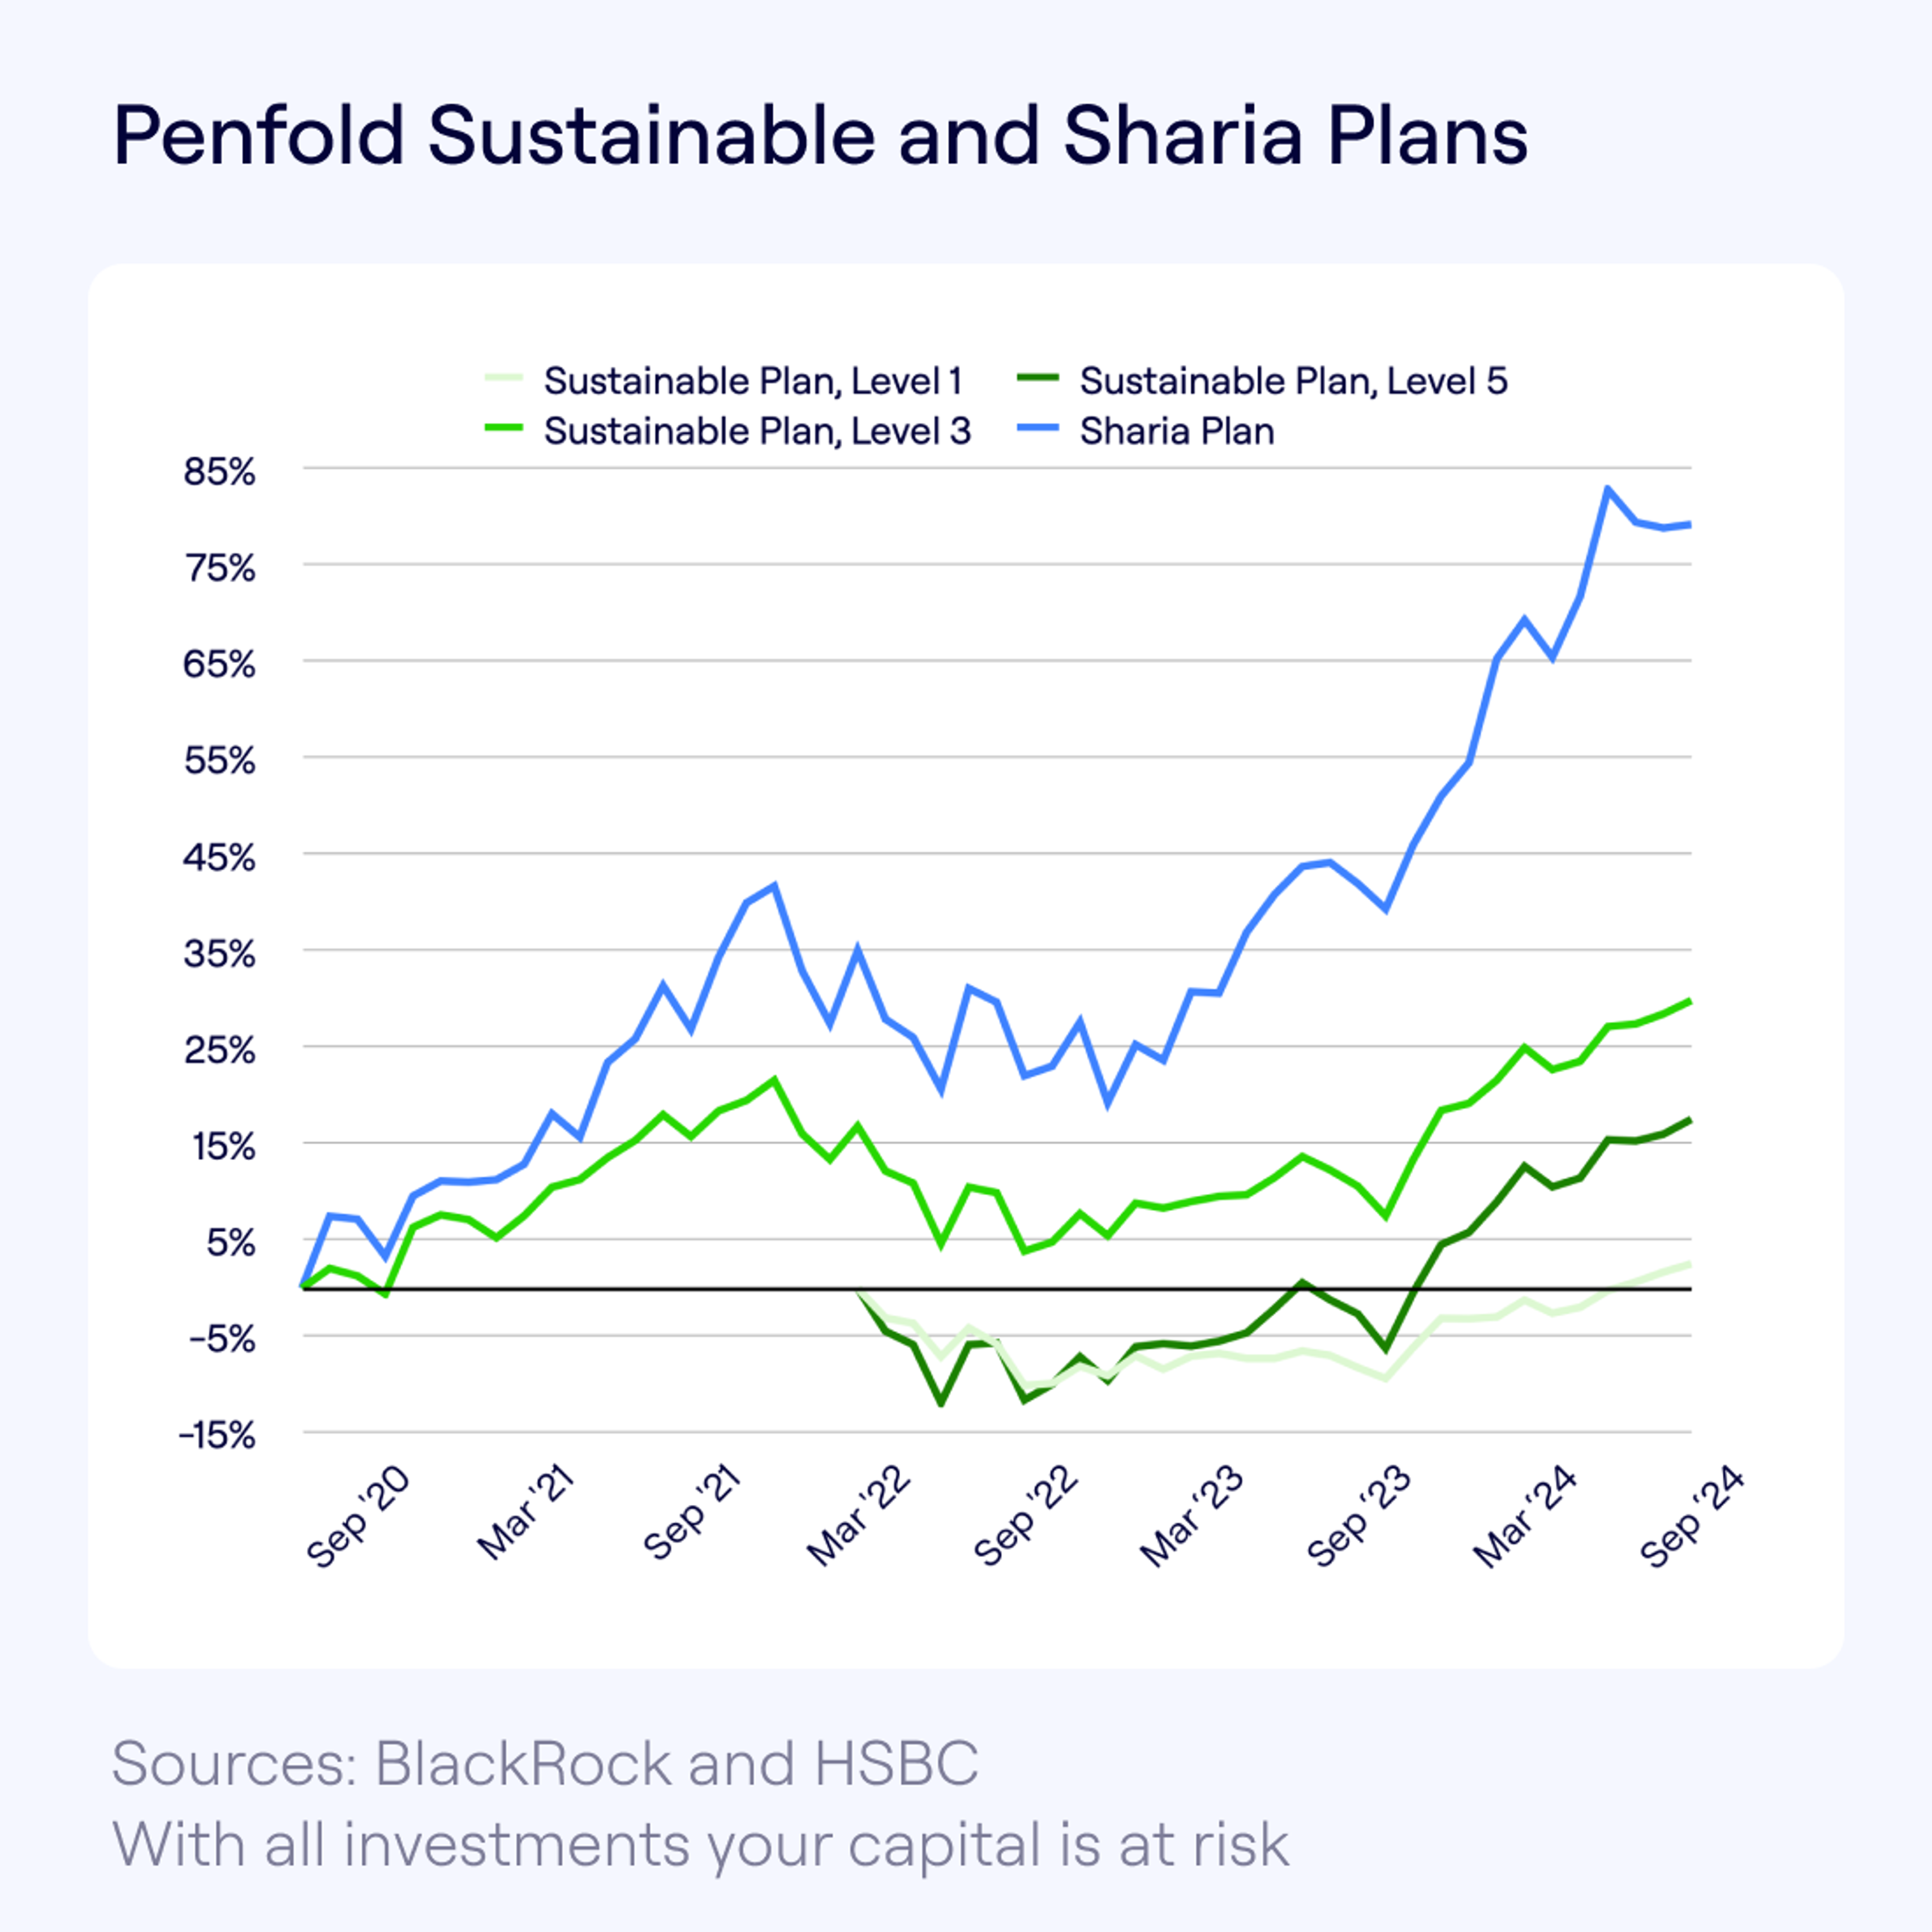
Our Sharia plan, which invests in companies that comply with Islamic finance principles, dropped by -2.0% between the beginning of July and the end of September.
But our Sustainable plans, which prioritise green and ethical options, performed well between the end of June and September:
- Risk level 1 rose by 2.8%
- Risk level 3 rose by 2.1%
- Risk level 5 rose by 1.8%
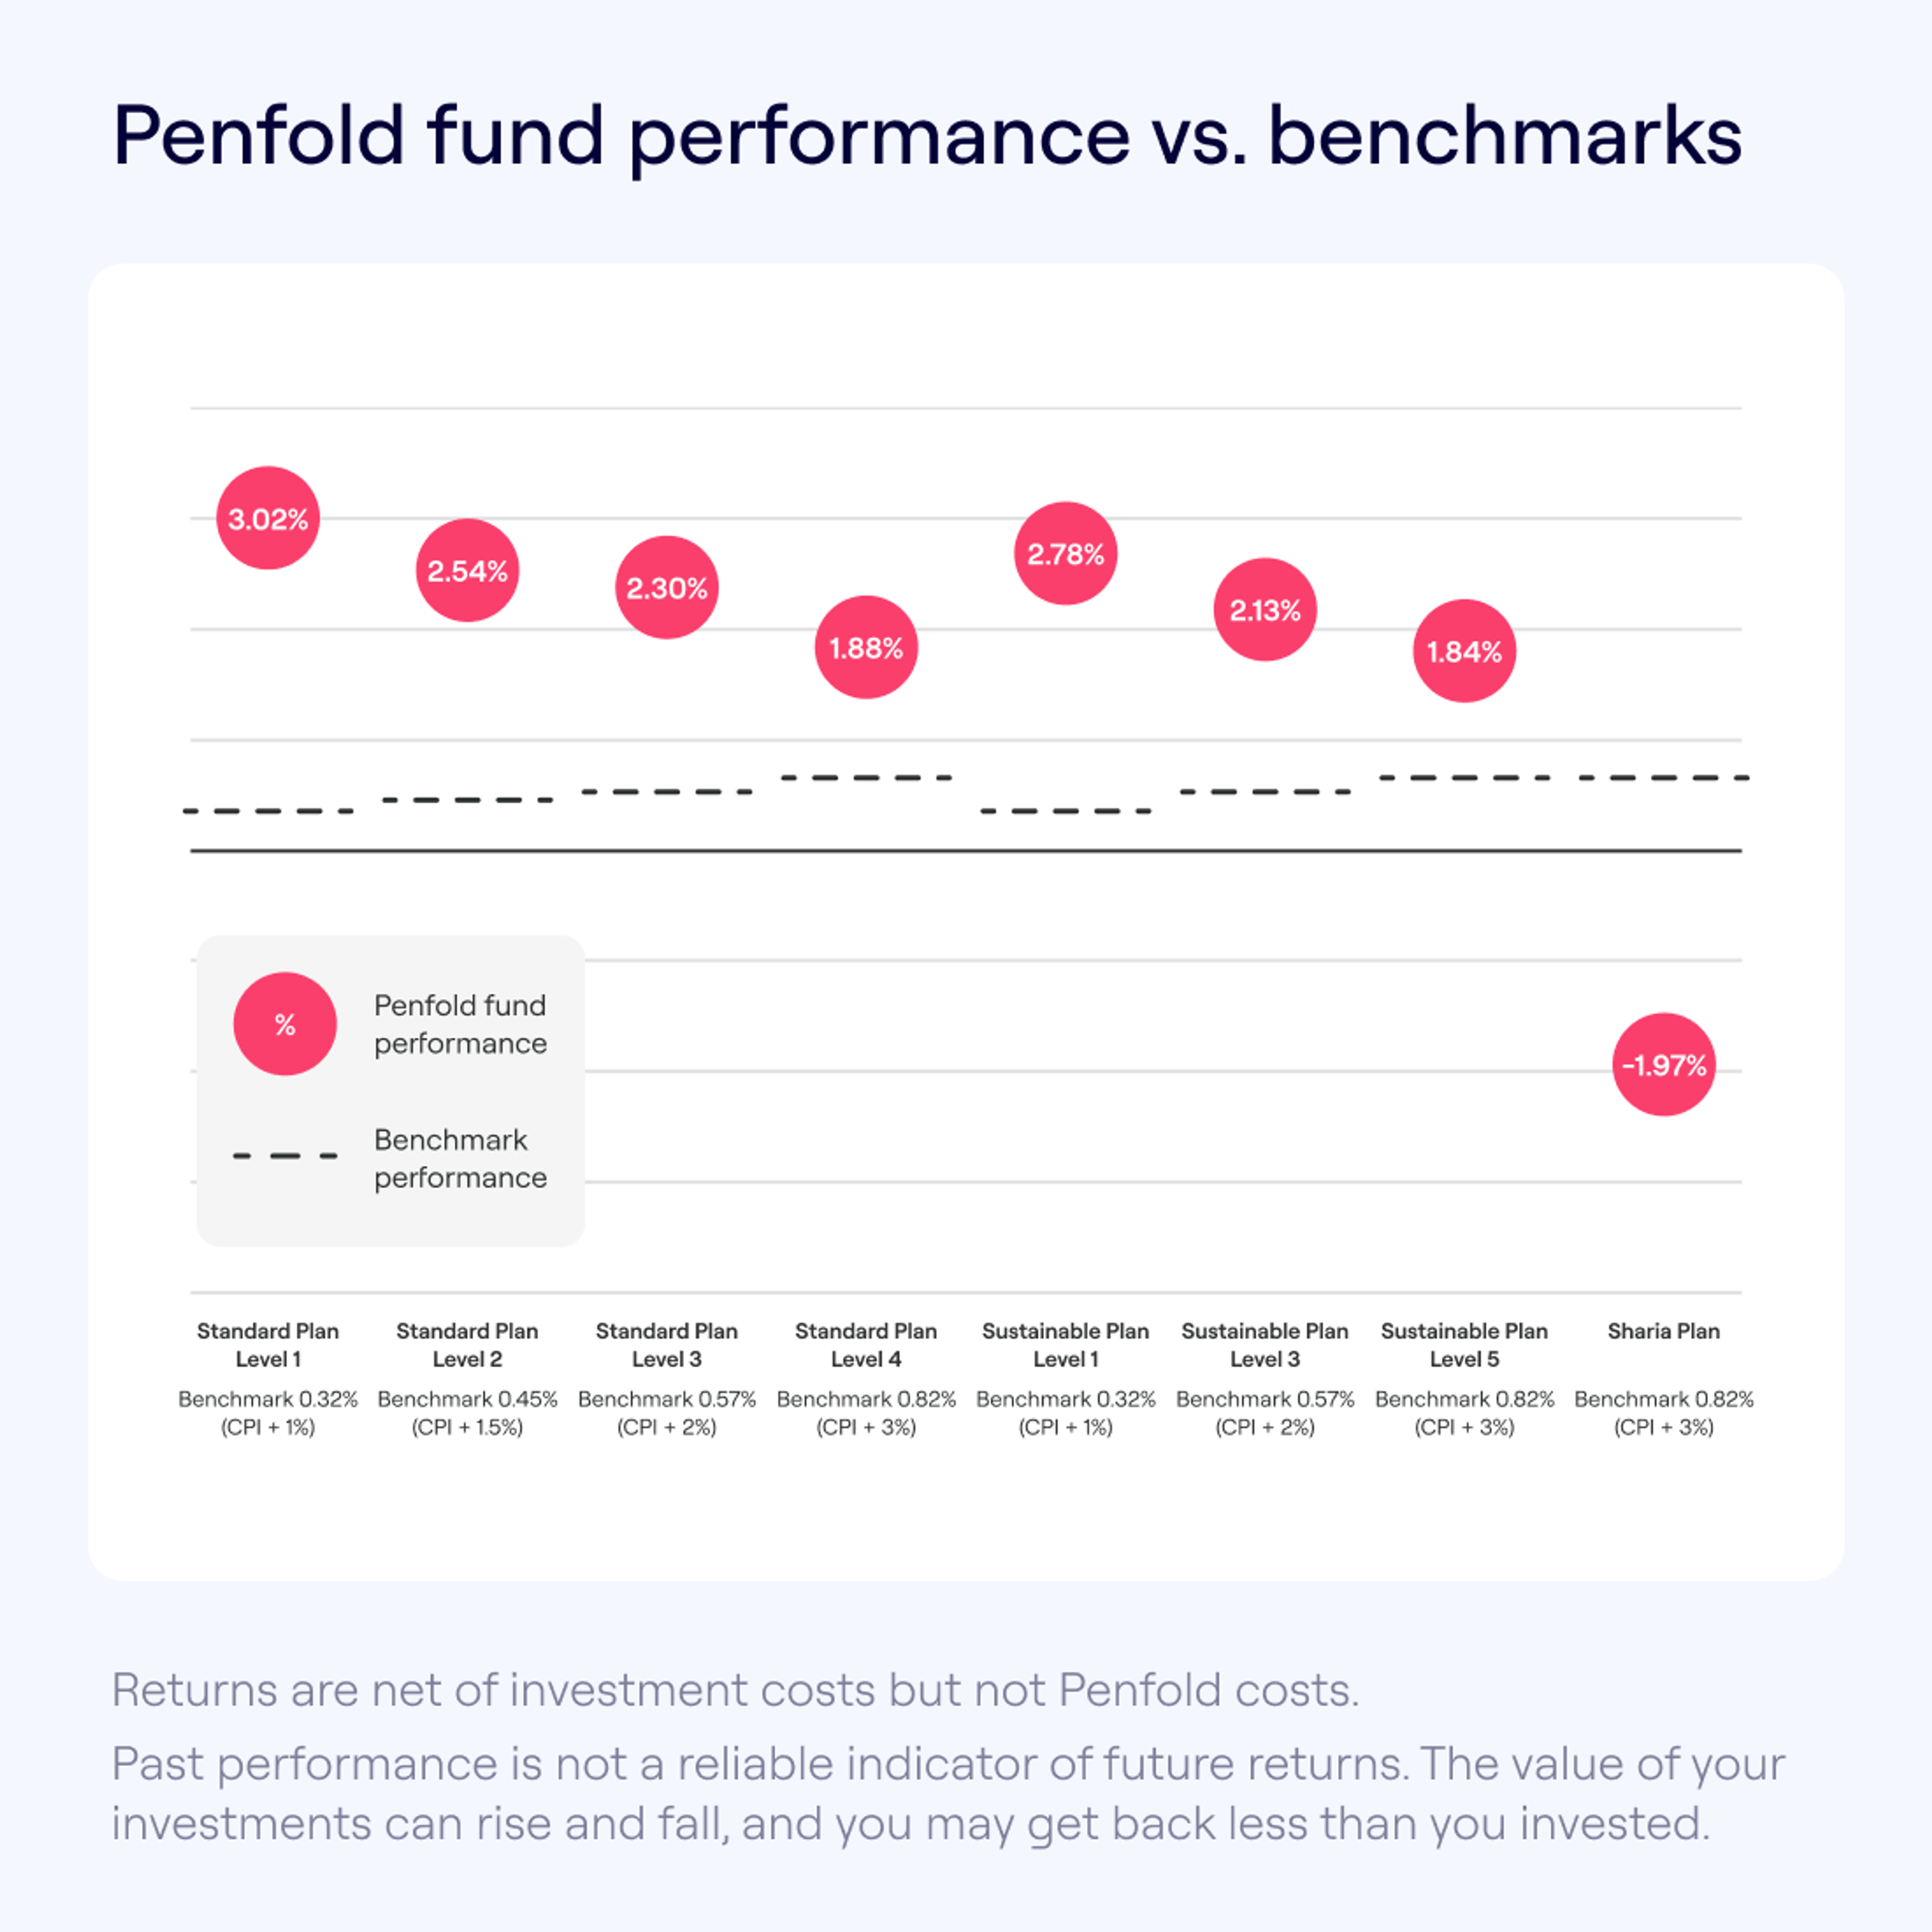
Penfold fund performance vs. benchmarks
When evaluating how well a fund is performing, it can be useful to compare it against a benchmark – an industry standard or reference point. For instance, if your fund achieves a return of 8% and the benchmark return is 6%, it’s outperforming by 2%.
The following chart shows how Penfold’s fund performance compares to a benchmark of CPI inflation + performance percentage in the period 1 July 2024 to 30 September 2024:
Our Tips: Stay Calm. Resist Urgent Changes. Stay Informed.
The stock market is always changing – but there’s no need to stay constantly up to date with it. Investing, especially in a pension, is a marathon, not a sprint.
If you’re worried, or if your pension pot value changes, follow these steps:
- Stay calm: Remember, pension are a long-term investment
- Resist urgent changes: Avoid making hasty decisions like withdrawing your money
- Stay informed: Understand what's happening in the markets and keep an eye on your Penfold app
Track Your Pension Performance
Want to see how your pension's investments are performing? Download the Penfold app and get access to your fund performance data whenever you need it.
Want to find out more about fluctuations? Get advice from Moneyhelper, the government’s free advice service.